ROSOMAXA
ROSOMAXA stands for Routing Optimizations with Self-Organizing Maps And EXtrAs - a custom evolutionary algorithm which
tries to address the problem of population diversity: ability to retain different individuals in the population and use
them as an input for the search procedure. Additionally, it utilizes reinforcement learning technics to dynamically pick
suitable meta-heuristics for given problem formulation to avoid premature convergence.
Key ideas
The rosomaxa algorithm is based on the following key ideas:
- use Growing Self-Organizing Map(GSOM) to cluster discovered solutions and retain good, but different ones
- choice clustering characteristics which are specific to solution geometry rather to objectives
- utilize reinforcement learning technics in dynamic hyper-heuristic to choose one of pre-defined meta-heuristics on each solution refinement step.
- use 2D visualization to analyze and understand algorithm behavior. See an interactive demo here
Clustering
Solution clustering is preformed by custom implementation of GSOM which is a growing variant of a self-organizing map.
In rosomaxa, it has the following characteristics:
- each node maintains a small population which keeps track of a few solutions selected by elitism approach
- nodes are created and split based on selected solution characteristics. For VRP domain, they are such as:
- vehicle max load variance
- standard deviation of the number of customer per tour
- mean of route durations
- mean of route distances
- mean of route waiting times
- average distance between route medoids
- amount of routes
- periodically, the network is compacted and rebalanced to keep search analyzing most prominent local optimum. Compaction is done using a "decimation" approach: remove every second-third (configurable) column/row and move survived cells towards the center (a node with (0, 0) as a coordinate). Overall, this approach seems help to maintain a good exploration-exploitation ratio.
Visualization
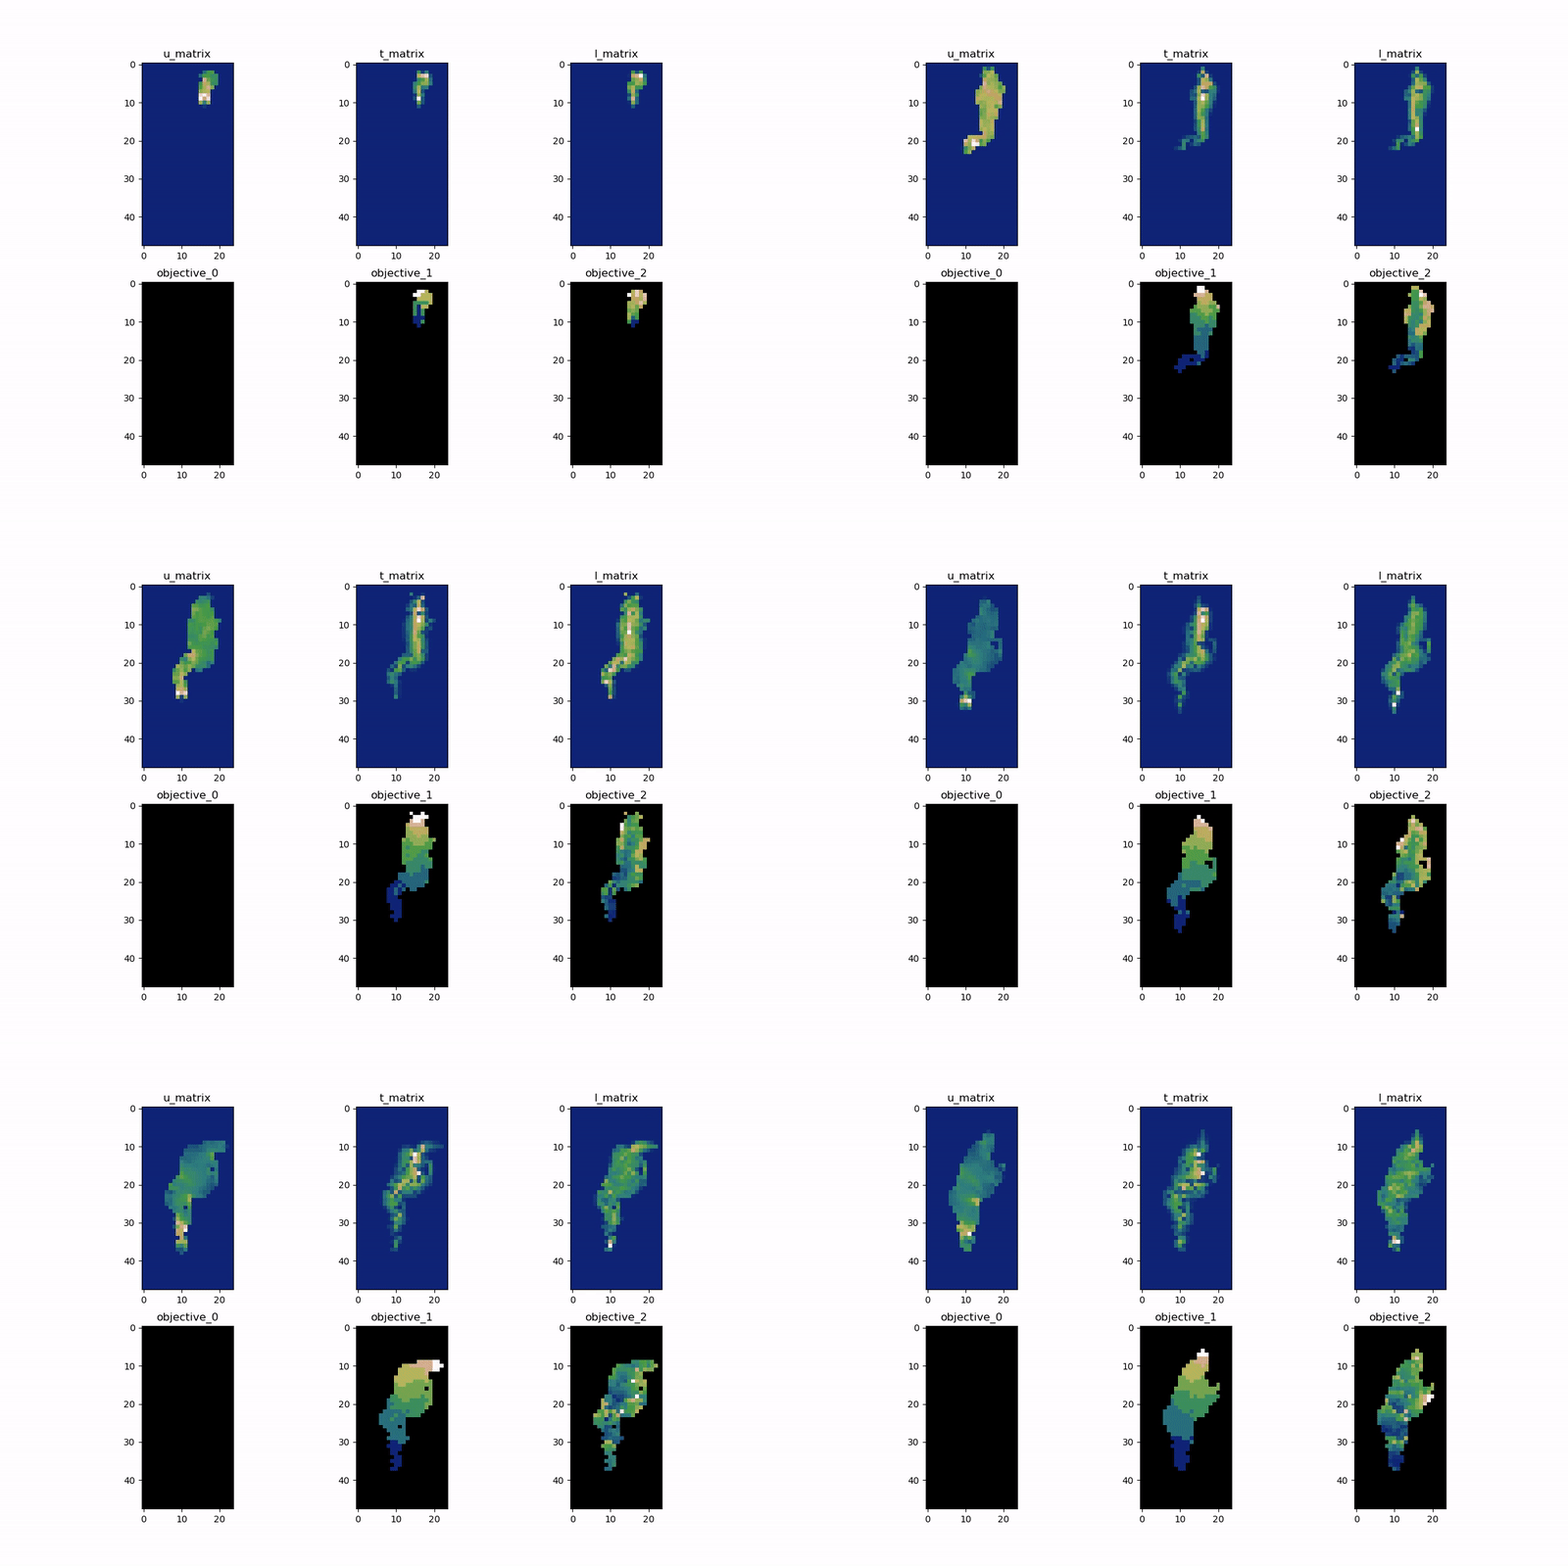
This old animation shows some insights how algorithms performs over time:

Here:
u_matrixis unified distance matrix calculated using solution characteristicst_matrixandl_matrixshows how often nodes are updatedobjective_0,objective_1,objective_2: objective values such as amount of unassigned jobs, tours, and cost
The new experimental visualization tool is part of the repo: experiments/heuristic-research.
Online version is available here: https://reinterpretcat.github.io/heuristics/www/vector.html
Dynamic hyper-heuristic
Essentially, a built-in dynamic hyper-heuristic uses Multi-Armed Bandit with Thompson sampling approach to pick meta-heuristic for the list. This helps to address exploration-exploitation dilemma in applying a strategy of picking heuristics.
Implementation can be found here
Additional used techniques
TODO: describe additional explorative techniques:
- tabu list usage in ruin methods
- alternative objectives manipulation
- ..
Further research
- experiment with different solution characteristics
- rebalance GSOM parameters based on search progression
- analyze "heat" map dynamically to adjust GSOM parameters
- more fine-grained control of
explorationvsexploitationratio - try to calculate gradients based on GSOM nodes